Monitoring Your Cluster After Enablement
After successfully setting up Cluster Orchestrator, you gain access to monitoring screens and dashboards that provide real-time insights into your cluster's performance, cost, and optimization opportunities. These dashboards are designed to help you track the effectiveness of your optimization settings and make data-driven decisions about your infrastructure.
Cluster Orchestrator provides four specialized views, each focusing on different aspects of your cluster:
1. Overview
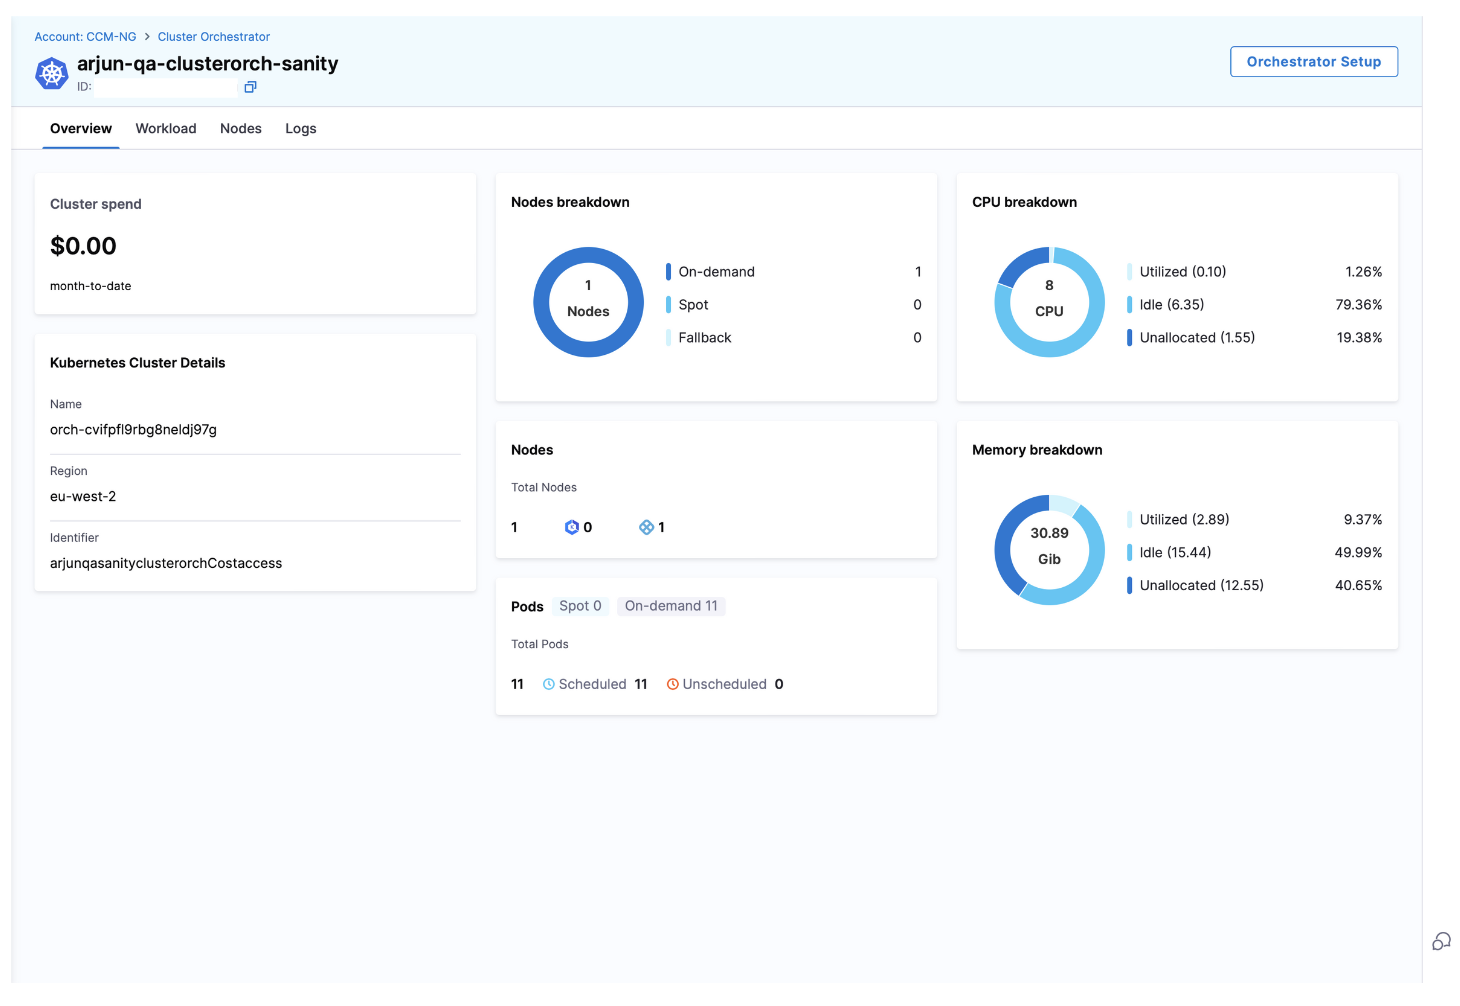
This is your central page for monitoring overall cluster health, performance, and cost metrics. The dashboard is divided into several key sections:
- Cluster Spend: Track your total cluster costs over time, with breakdowns by instance type and spot vs. on-demand usage
- Cluster Details: View essential information about your cluster including name, region, and identifier.
- Nodes Breakdown: Visualize your node distribution by fulfillment method (spot vs. on-demand)
- CPU Breakdown: Track CPU allocation, usage, and available capacity across your cluster
- Memory Breakdown: Monitor memory allocation, usage, and available capacity
- Pod Distribution: See how many pods are there as spot, on-demand scheduled and unsecheduled
2. Workloads screen
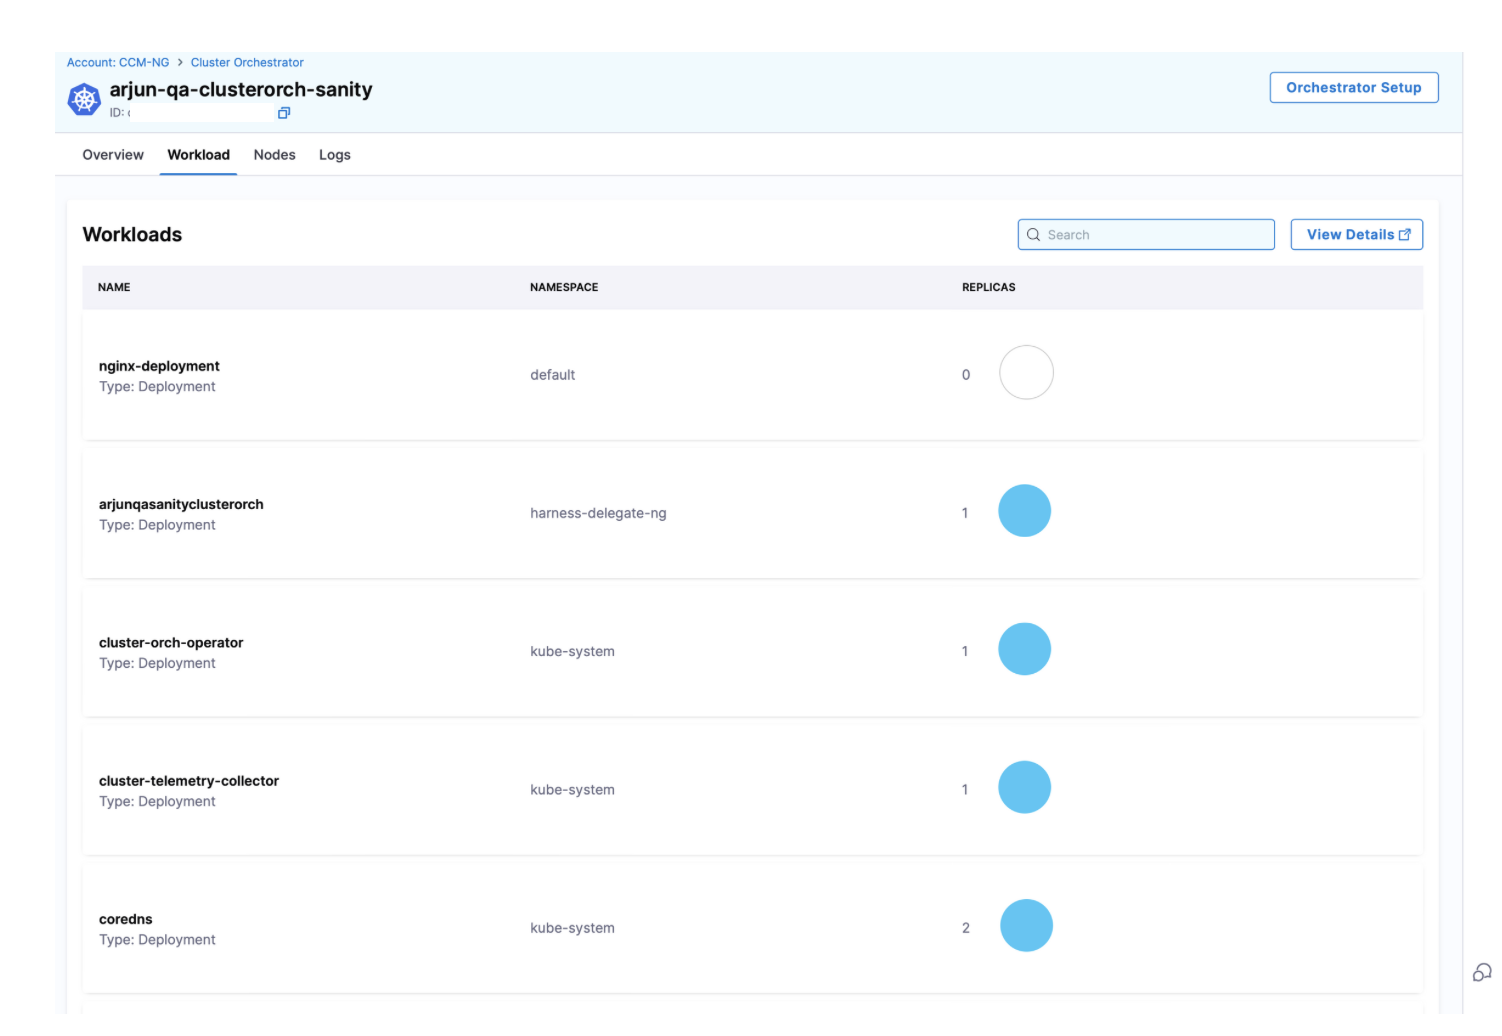
This view focuses on the applications running in your cluster, helping you identify optimization opportunities at the workload level:
- Namespace Organization: View workloads grouped by namespace for logical organization
- Replica Count: Track the number of replicas for each workload
3. Nodes screen
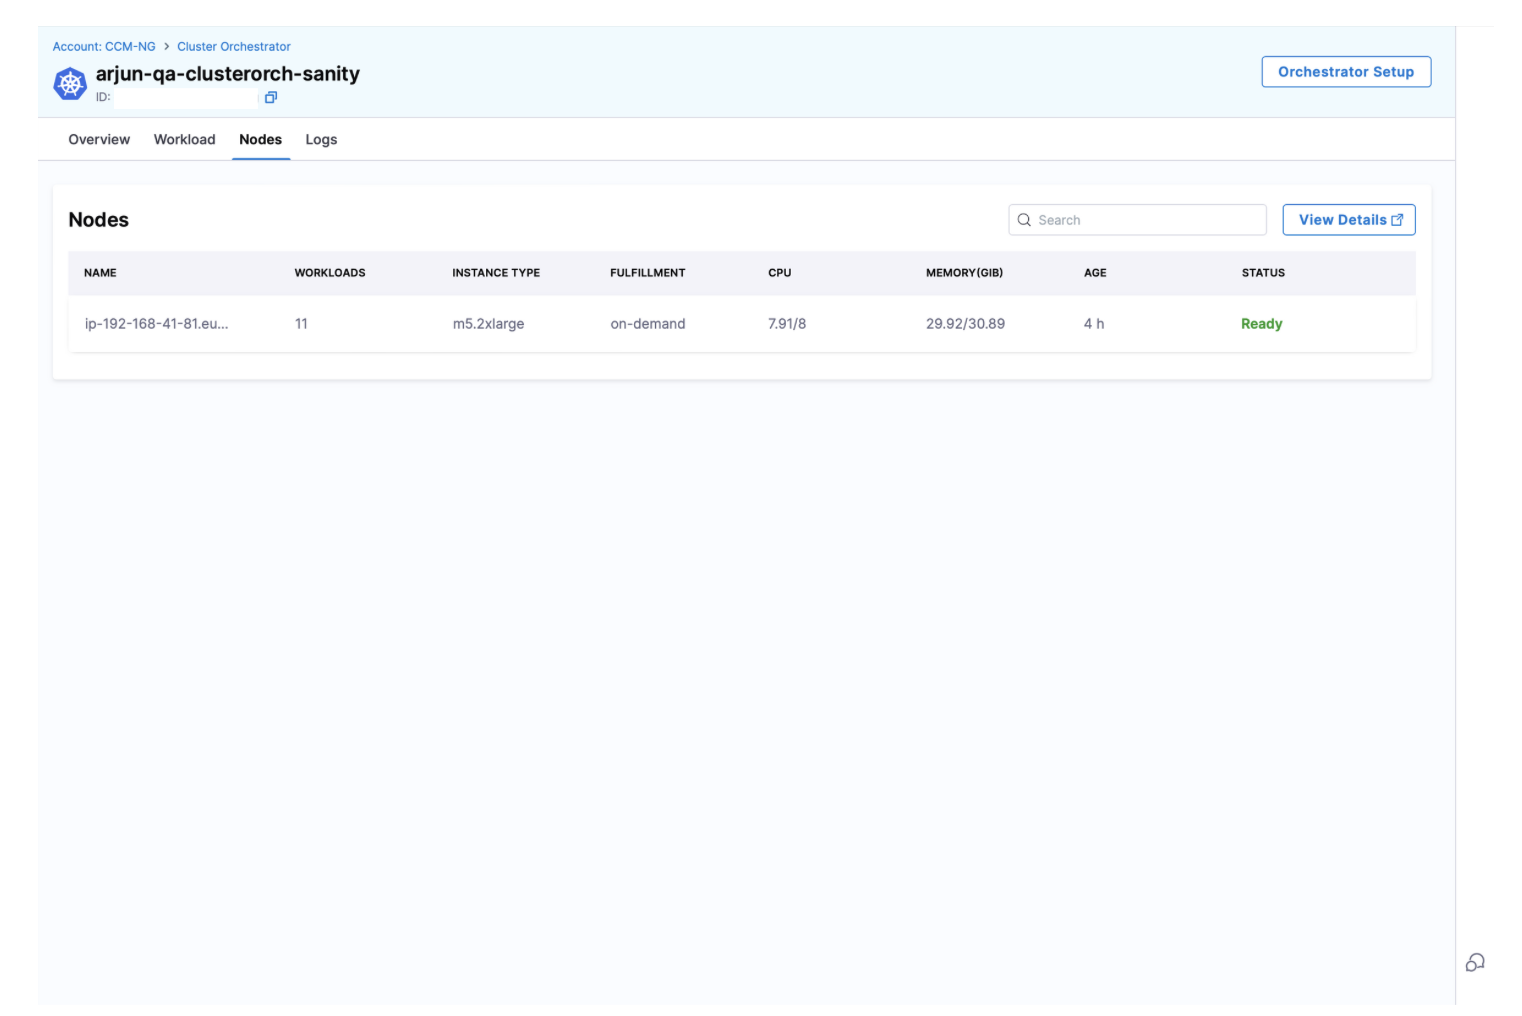
This view provides insights into your cluster's infrastructure. The table displays the following information for each node:
| Column | Description |
|---|---|
| Node Name | The full hostname of the node |
| Workloads | Number of workloads running on the node (e.g., 11) |
| Instance Type | The AWS instance type (e.g., m5.2xlarge) |
| Fulfillment | Whether the node is running as spot or on-demand |
| CPU | Current CPU usage and total capacity (e.g., 7.91/8) |
| Memory (GiB) | Current memory usage and total capacity (e.g., 29.92/30.89) |
| Age | How long the node has been running (e.g., 2h) |
| Status | Current node status (e.g., Ready or not ) |
4. Logs
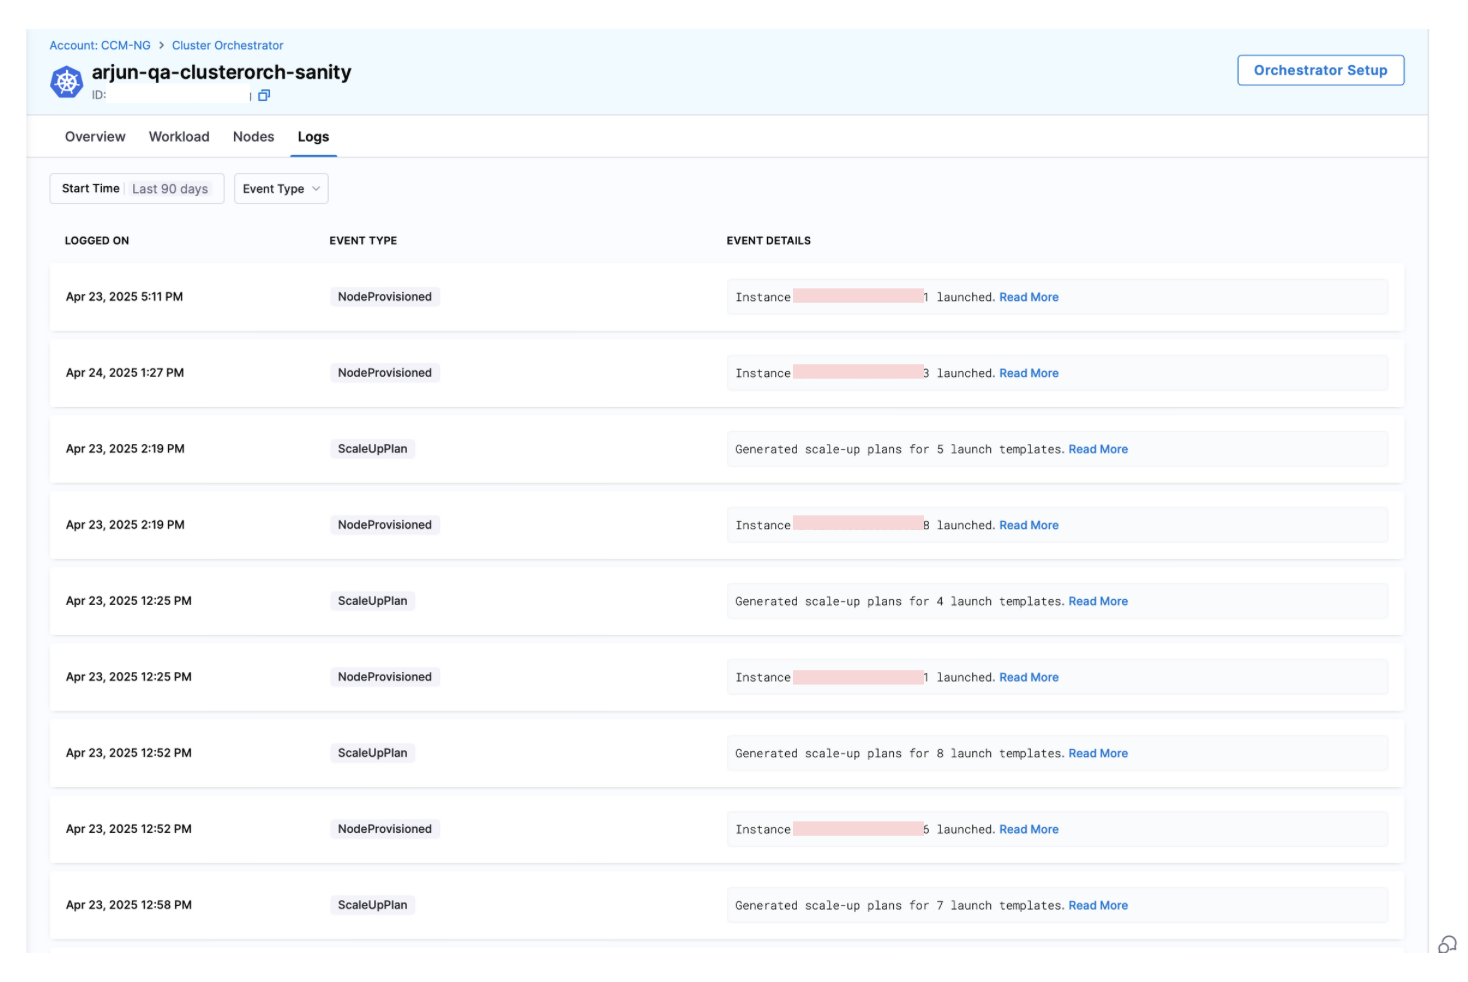
The Logs screen provides a chronological record of all cluster events and optimization activities. You can filter events by time period (e.g., Last 90 days) and event type.
| Column | Description |
|---|---|
| Logged On | Timestamp when the event occurred (e.g., Apr 23, 2025 5:11 PM) |
| Event Type | Category of the event (see types below) |
| Event Details | Description of what happened |
Event Types
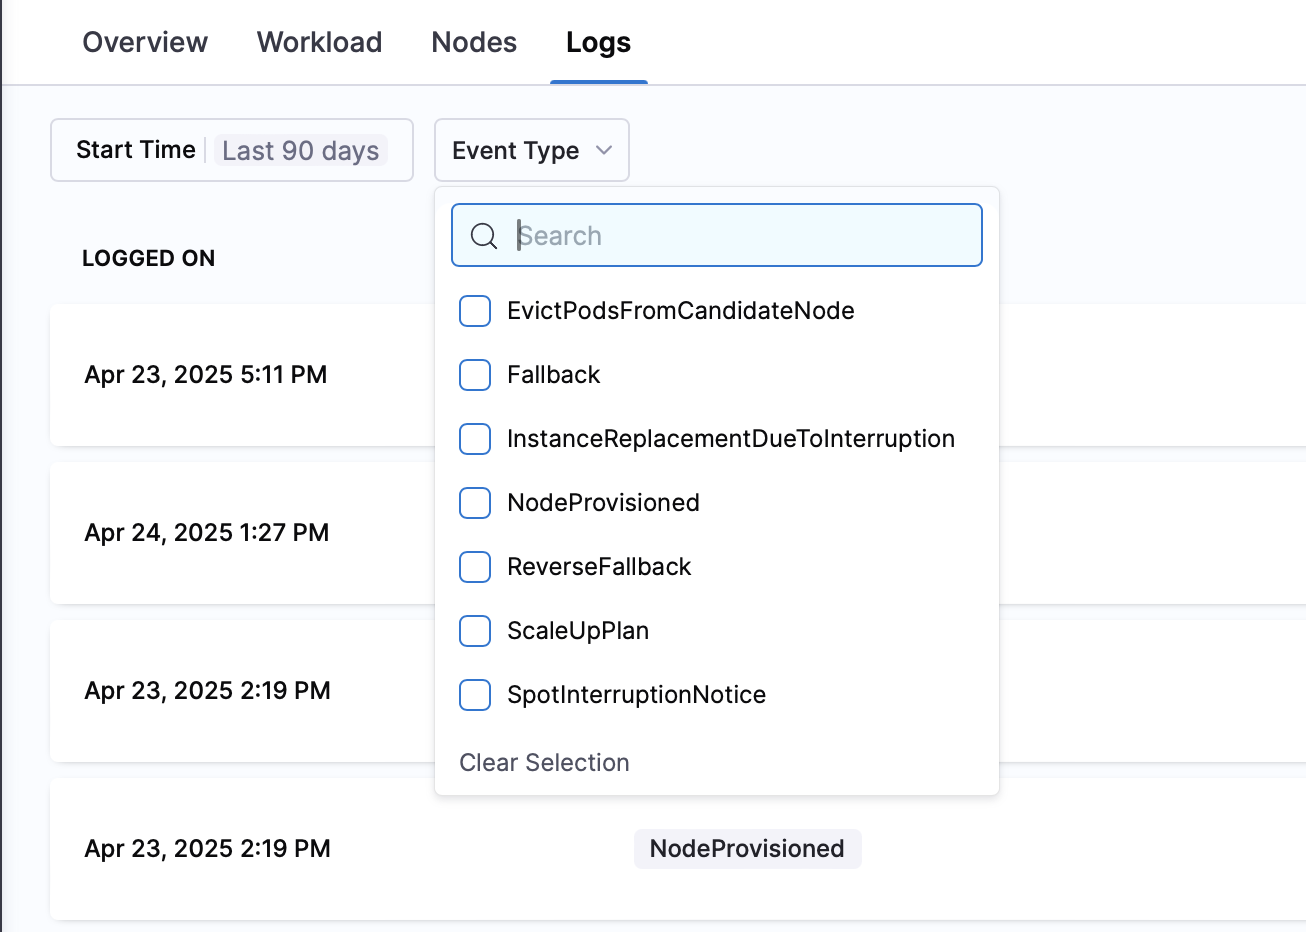
The logs track several types of events that help you understand cluster activity:
- NodeProvisioned: When new instances are launched (e.g., "Instance i-0138fc81dc9c82e31 launched")
- ScaleUpPlan: When the system generates plans to scale up resources (e.g., "Generated scale-up plans for 5 launch templates")
- EvictPodsFromCandidateNode: When pods are evicted as part of optimization activities
- Fallback: When workloads transition from spot to on-demand instances due to unavailability
- ReverseFallback: When workloads transition back from on-demand to spot instances
- InstanceReplacementDueToInterruption: When instances are replaced due to spot interruptions
- SpotInterruptionNotice: When AWS sends a notification that a spot instance will be interrupted